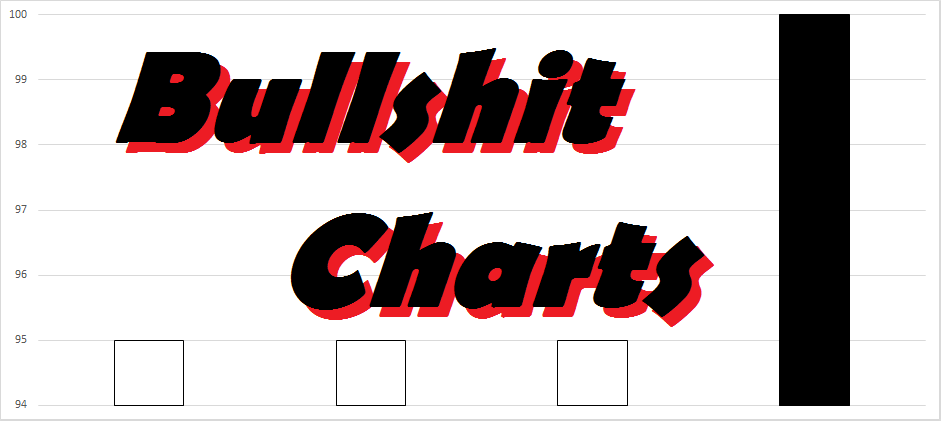
Possibly the most widespread form of Statistical Bullshit is Bullshit Charts. Charts are meant to provide clear and easy-to-read information, but Bullshit Charts are designed to mislead the reader – whether intentionally or unintentionally. Often, these charts will alter common cues that the reader expects, hoping that the reader will not notice these subtle changes. Through doing so, the chart is not “lying” per se, but it is certainly Statistical Bullshit!
Bullshit Charts are common in situations with little time to process all relevant information, such as during a commercial or business meeting. And I’m sure you’ve experienced this before. Maybe a commercial presented a chart for a split second, showing that their product is superior to others. It may have looked reasonable, but if you could only pause the TV, you could have seen that the x- or y-axis was mislabeled. In other words, it was indeed a misleading Bullshit Chart.
Below are some of my favorite examples of Bullshit Charts. The Statistical Bullshit should be apparent in each of these charts, but please email me at MHoward@SouthAlabama.edu if you have any questions or comments about these charts. Until next time, watch out for Statistical Bullshit!
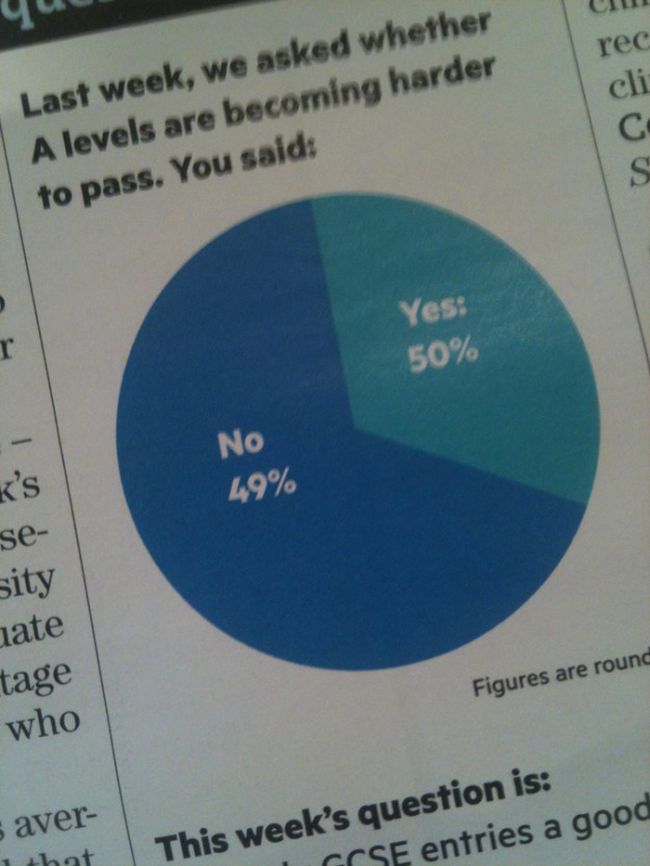
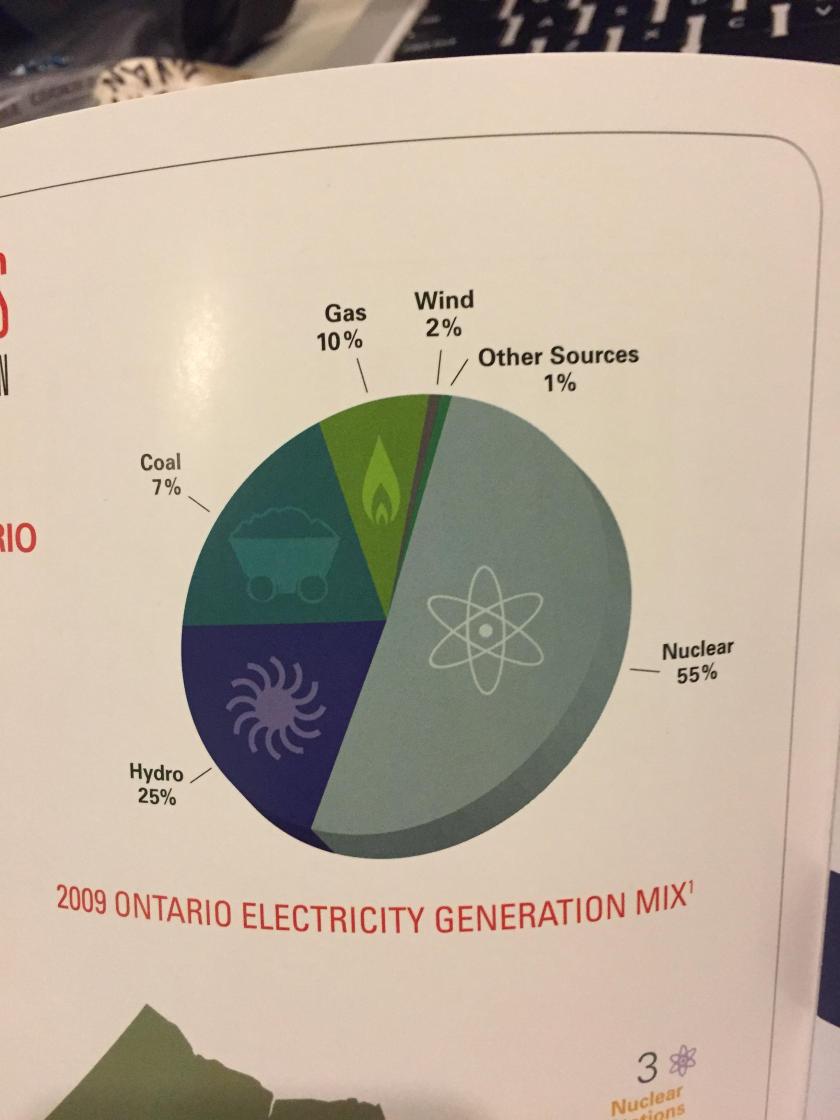
1. Need to make your argument seem more convincing? Just give yourself a bigger slice of the pie no matter what the data shows…
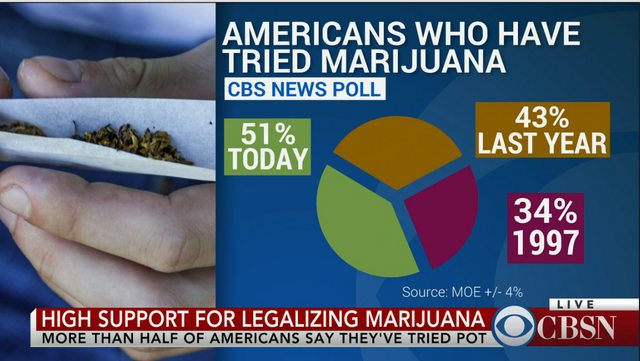
2. Again, just change the distribution of the pie to help your case! Or make up the data, as these labels and percentages seem to not make any sense at all…
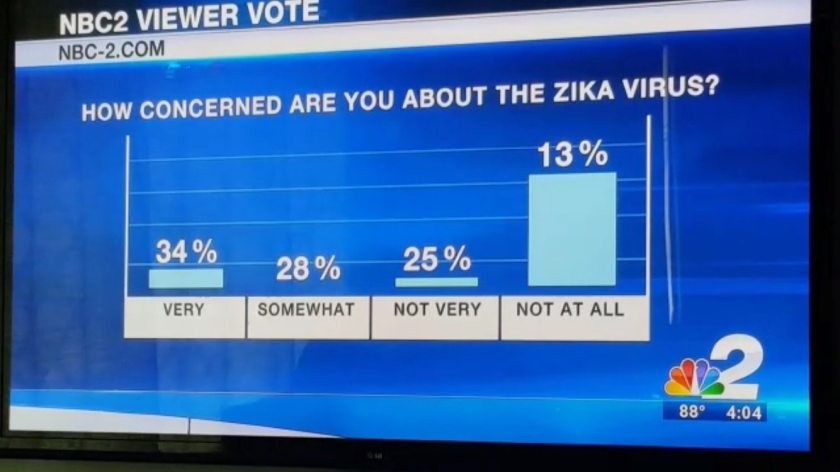
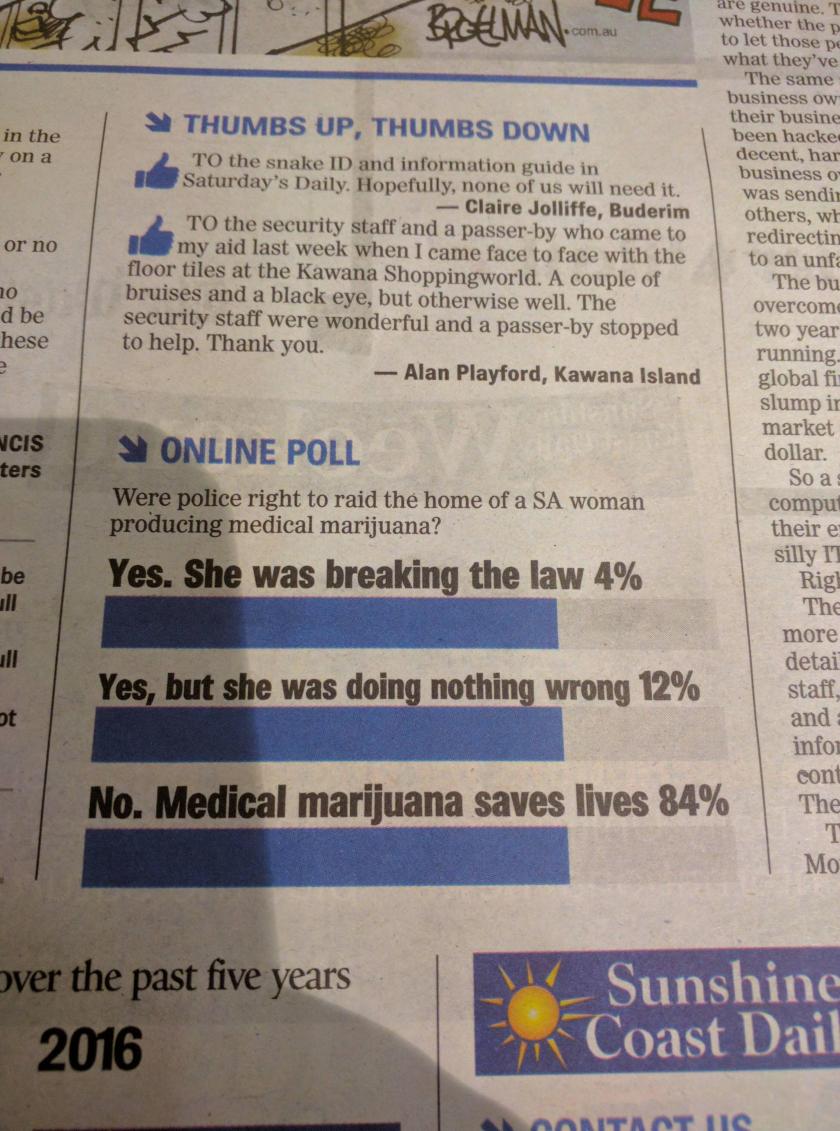
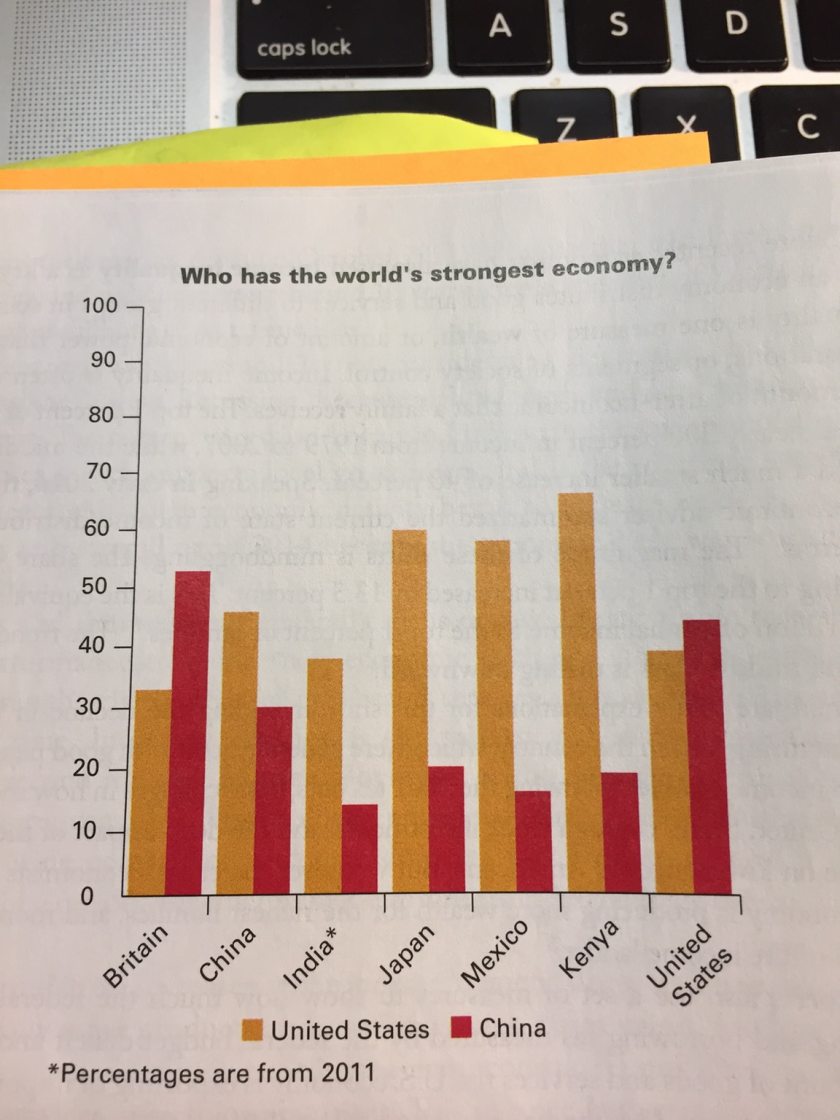
3. Or, just ignore the size of the bars.
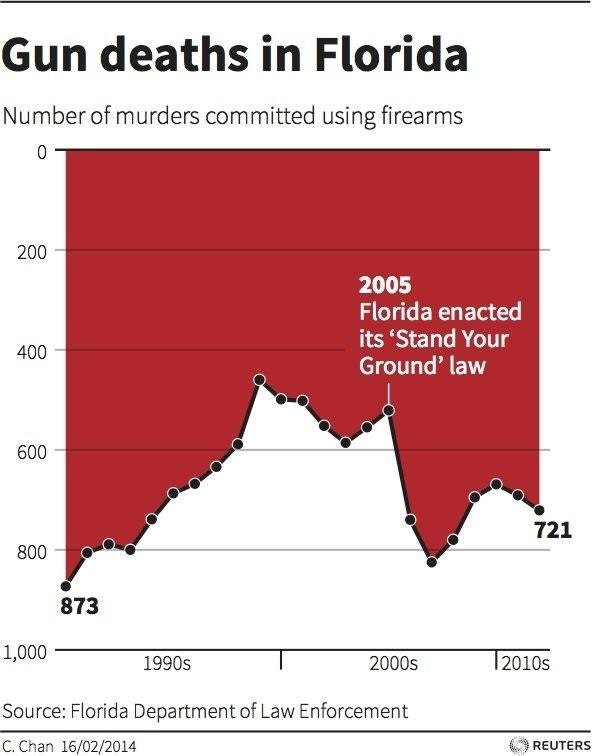
4. Does the data disprove your claim? Just flip the chart upside down to make it seem like you’re correct!
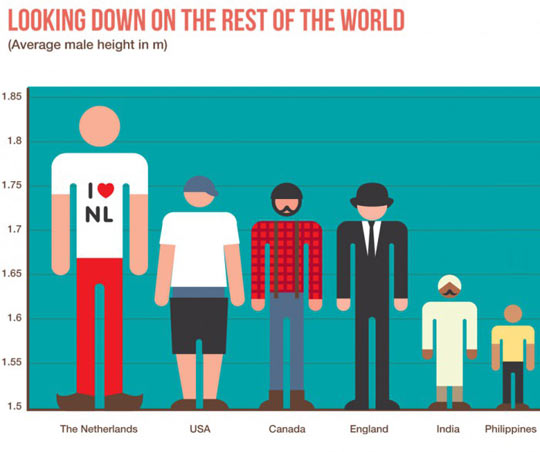
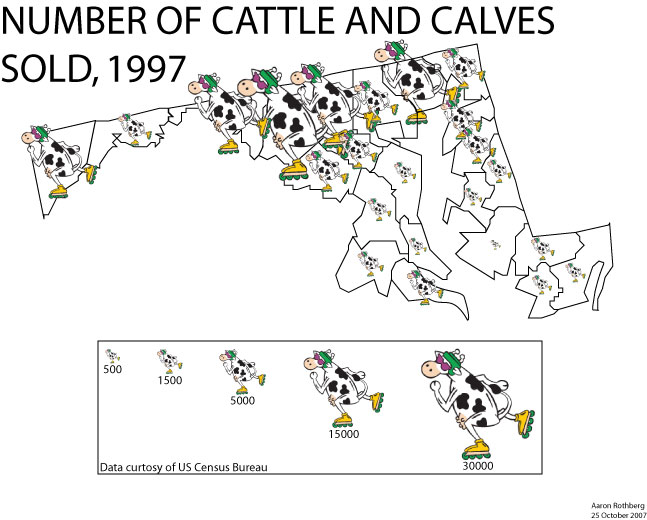
5. Although those in the Philippines may only be ~.2 meters shorter than those in The Netherlands, you can always draw them as about 1/3rd the size to prove a point…
6. Again, you could just ignore the size of the bars altogether.
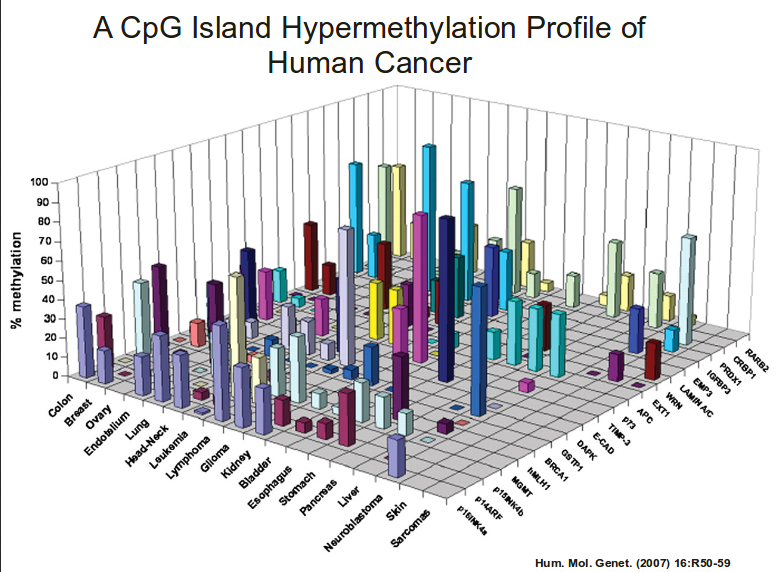
7. I’ve seen this trend catching on more recently. Three-dimensional charts are often difficult to read. If you want to prove a point, it is rarely a good idea to use 3-D charts.
8. Then again, some two-dimensional charts aren’t much better…
9. So, sometimes it’s just easiest to go back to giving yourself a bigger slice of the pie.
10. If all else fails, just give your chart nonsense labels and just hope for the best!
Sources for these and other Bullshit Charts:
https://www.reddit.com/r/dataisugly/
https://www.reddit.com/r/shittydataisbeautiful/
https://www.reddit.com/r/badstats/
