This post is inspired by an interaction that I had while consulting. I was hired as a statistical analyst, and my duties included reviewing analyses that were already conducted internally. Most of the organization’s prior analyses were appropriate, but I noticed that certain assumptions were based on completely inappropriate mean comparisons. These assumptions led to needless practices that cost time and money – all because of Statistical Bullshit. Today, I want to teach you how to avoid these issues.
Let’s first discuss when mean comparisons are appropriate. Mean comparisons are appropriate if you (A) want to obtain a general understanding of a certain variable or (B) want to compare multiple groups on a certain outcome. In the case of A, you may be interested in determining the average amount of time that a certain product takes to make. From knowing this, you could then determine whether an employee is taking more or less time than the average to make the product. In the case of B, you may be interested in determining whether a certain group performed better than another group, such as those that went through a new training program vs. those that went through the old training program. The data from such a comparison may look something like this:
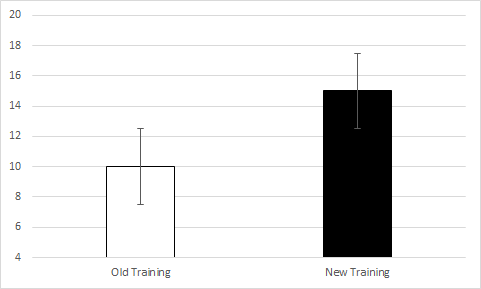
So, from this comparison, you may be able to suggest that the new training program is more effective than the old training program; however, you would need to run a t-test in be sure of this.
Beyond these two situations, there are several other scenarios in which mean comparisons are appropriate, but let’s instead discuss an example when mean comparisons are inappropriate.
Say that we wanted to determine the relationship between two variables. Let’s use satisfaction with pay (measured on a 1 to 7 Likert scale) and turnover intentions (also measured on a 1 to 7 Likert scale). As you probably already know, we could (and probably should) determine the relationship between these two variables by calculating a correlation. Imagine instead that you decided to calculate the mean of the two variables and the results looked like this:
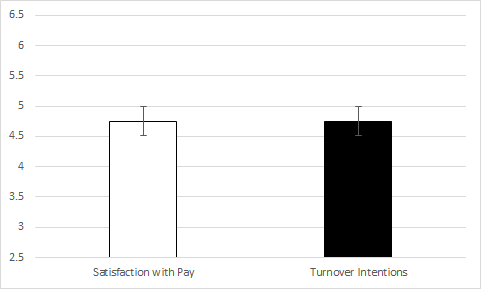
Does this result indicate that there is a significant relationship between the two variables? In my prior consulting experience, the internal employee who ran a similar analysis believed this to be true. That is, the internal employee believed that two variables with similar means are significantly related; however, this couldn’t be further from the truth. Let’s look at the following examples to find out why.
Take the example that we just used – satisfaction with pay and turnover intentions. Which of the following scatterplots do you believe represents the data in the bar chart above?
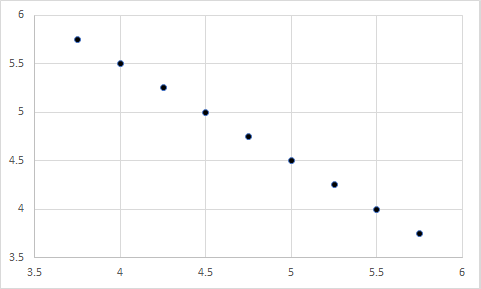
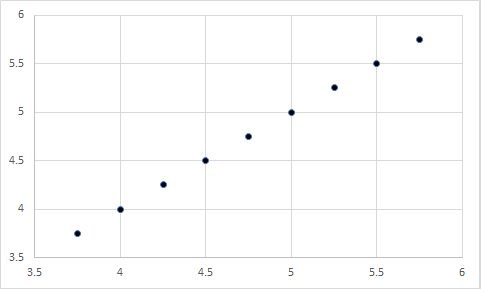
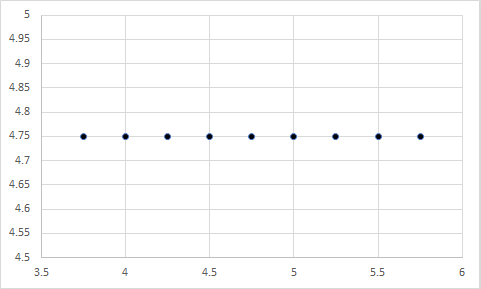
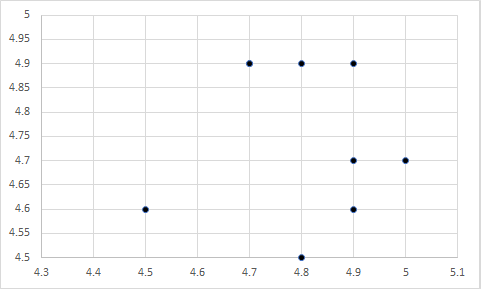
Still don’t know? Here is a hint: The first chart represents a correlation of 1, the second represents a correlation of -1, the third represents a correlation of 0, and the fourth represents a correlation of 0. Any guesses?
Well, it was actually a trick question. Each figure could represent the data in the bar chart above, because the X and Y variables in each have a mean of 4.75…well, the last one is off by a few tenths, but you get my point.
So, if the means of two variables are equal, their relationship could still be anything – ranging from a large negative relationship, to a null relationship, to a large positive relationship. In other words, the means of two variables have nothing to do regarding their relationship.
But does it work the other way? That is, if the means of two variables are extremely different, could they still have a significant relationship?
Certainly! Let’s look at the following example using satisfaction with pay (still measured on a 1 to 7 Likert scale) and actual pay (measured in thousands of dollars).
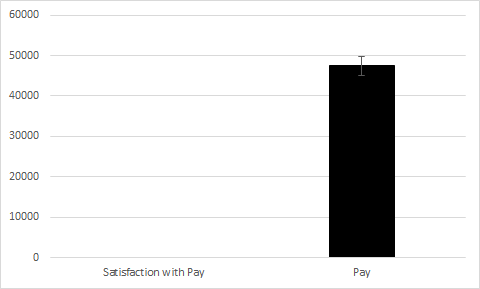
As you can see, the difference in the means is so extreme that you can’t even see one bar! Now, let’s look at the following four scatterplots:
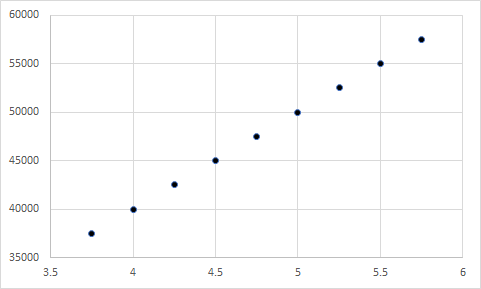
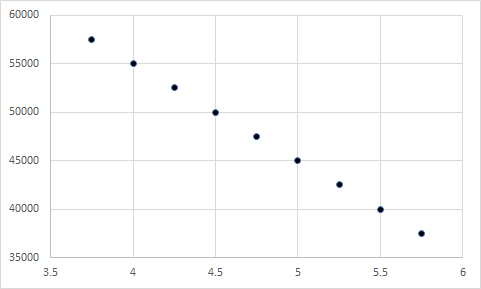
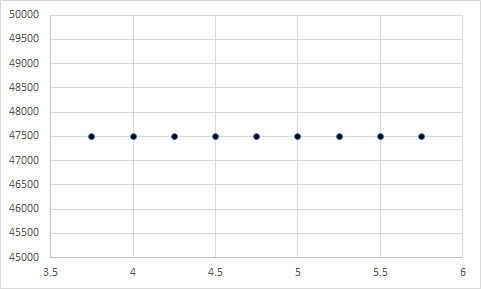
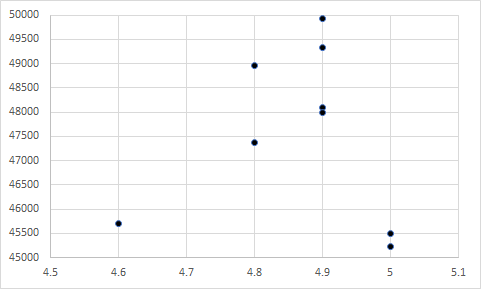
Seem a little familiar? As you guessed, the first represents a correlation of 1, the second represents a correlation of -1, the third represents a correlation of 0, and the fourth represents a correlation of 0. More importantly, each of these include a Y variable with a mean of 4.75 and an X variable with a mean of 47500. Although the means are extremely far apart, they have no influence on the relationship between two variables.
From these examples, it should be obvious that the mean of two variables has no influence on their relationship – no matter if the means are close together or far apart. Instead, it is the covariation between the pairings of the X and Y values that determine the significance of their relationship, which may be a future topic on StatisticalBullshit.com or even MattCHoward.com (especially if I get enough requests for it).
Now that you’ve read this post, what will you say if you are ever at work and someone tries to tell you that two variables are related because they have similar means? You should say STATISTICAL BULLSHIT! Then demand that they calculate a correlation instead…or a regression…or a structural equation model…or other things that we may cover one day.
That’s all for this post! Don’t forget to email any questions, comments, or stories. My email is MHoward@SouthAlabama.edu, and I try to reply ASAP. Until next time, watch out for Statistical Bullshit!